加载中...
共找到 24,789 条相关资讯

The higher yield shows Wall Street is nervous about inflation. Still, the stock market is confident—for several reasons—that the benchmark yield won't inch up much more.

The GDP value of AI is smaller than it might appear given that a lot of high-tech equipment is imported, according to a recent MRB Partners report.

Nasdaq eyes all-time high after recapturing 50-day MA at 23,273. Tech stocks lead rally as investors await Apple, Meta, Microsoft earnings and Fed decision.

Stocks are considered an inflation hedge.

US Treasuries remain a risk-free, income-producing asset, even amid speculation about large-scale European selling. European holdings of $2T in Treasuries reflect decades of export surpluses, with no incentive to switch to non-interest cash.
The winter storm that just pummeled the country is likely to take a chunk out of U.S. growth in the first quarter, making it even harder to figure out what is going on in the economy.

By one measure, silver has caught up to gold. And then some.

Attacking Europe Is Bearish For U.S. Assets: Fortunately, There's A Playbook For How To Position

Investing in China is always fraught with political tensions from the ruling government. Alibaba and Tencent's woes are just two recent examples.

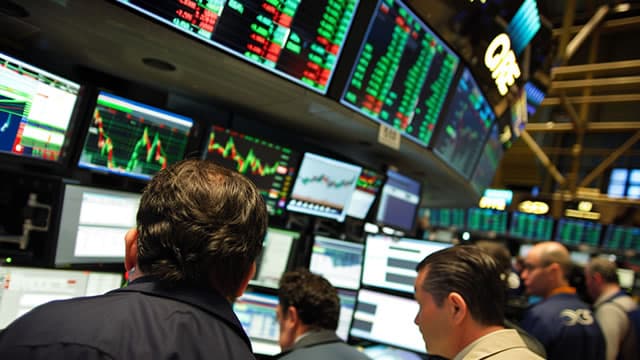
The U.S. stock market's resiliency will be tested this week by quarterly earnings results, after rebounding from recent bouts of volatility this month on tariff-related fears.
Wall Street lost steam last week as markets grappled with widening policy uncertainty, which went well beyond Greenland. While earnings continued to drive stock-specific volatility—notably Intel's 17% plunge—the broader narrative was one of investor fatigue with U.S. policy reversals and an expanding range of potential escalation points.

Implied volatilities were higher across the major asset classes last week as the markets strove to process the economic implications of the US' demand for Greenland. Gold volatility led the advance as the safe haven asset shattered the $5,000/oz threshold and surged to record highs.

Former Kansas City Fed President Thomas Hoenig joins 'Money Movers' to discuss the upcoming Fed meeting, the strength of the Japense yen, and more.
Michelle Gibley with @CharlesSchwab turns to Japanese markets to explain why "yen intervention" can impact U.S. investors. She compares the risk with the Yen Carry Trade seen two years ago to highlight what makes this different from that event.

Spending on artificial intelligence by large corporations will continue to grow exponentially and reshape the economy, Bridgewater Associates' co-chief investment officers said in a client note on Monday.

CNBC's "Squawk on the Street" marked its 20th anniversary on Monday by ringing the opening bell at the New York Stock Exchange! Join us in celebrating two decades of trusted market coverage, expert voices and live perspective from the heart of Wall Street.

From his inauguration day last year through Jan. 20, 2026, the S&P 500 rose 13.3% – the worst start to a presidency in 20 years, since George W. Bush entered his second term.

Morning Brief anchor Julie Hyman breaks down the latest market moves for January 26, 2026. A brutal winter storm impacted a large portion of the United States over the weekend and into Monday.

A combination of high and improving returns on equity and low or declining price/earnings ratios make the case for several major industry players.

Commodities Lead Major Asset Classes So Far In 2026