加载中...
共找到 21,359 条相关资讯
Worries over the destructive impact of artificial intelligence on the U.S. economy were sweeping through the $30 trillion bond market on Friday.
"Bloomberg Real Yield" highlights the market-moving news you need to know. Today's guests: Société Générale Americas Head of Research Subadra Rajappa, JPMorgan Asset Management Fixed Income Portfolio Manager Kelsey Berro, and Barclays Global Head of Debt Capital Markets Meghan Graper.
Block's layoffs exacerbated concerns that artificial-intelligence could decimate employee counts and hurt demand for software.

The latest round of financial results is one bright spot that might carry stocks to new highs, despite this year's turmoil.
January's Producer Price Index from the Bureau of Labor Statistics came in hotter than expected. For businesses navigating tariff swings and fragile global supply chains, rising service margins signal that cost pressure is rippling through logistics and distribution channels.
It was a whipsaw week of price action for all three major indexes, as investors endured increased geopolitical tensions, AI sustainability pressure , and a lackluster earnings response from market-moving Nvidia (NVDA).
US retailer's decision comes as RFK Jr and Maha movement increase pressure on food industry to drop dyes like red 40

Jack Dorsey is not the first chief executive to say artificial intelligence will transform work. He may be among the first to act as if it already has - and to say so openly.

Growing fears of AI disruption have been a key theme here in February, with the SaaSpocalypse hitting the software sector hard. The recent SCOTUS decision around tariffs put tariff policies in turmoil, and that uncertainty will remain with the markets for the time being.
U.S. wholesale prices came in hotter than expected last month. The Labor Department reported Friday that its producer price index, which measures inflation before it hits consumers, rose 0.5% from December and 2.9% from January 2025.
“Positive,” according to an unnamed senior U.S. official who spoke to Axios, which reported Omani Foreign Minister Badr Al Busaidi, a mediator in the negotiations, said the talks have shown “significant progress.” Al Busaidi is meeting with Vice President JD Vance and other U.S. officials in Washington on Friday, with negotiations slated to continue next week.
Publicly traded private equity stocks are taking it on the chin again today, continuing an extremely rough stretch for the group that began in early January. The reason for the recent plunge: fears of overexposure to software companies that are suddenly at risk of extinction from AI.

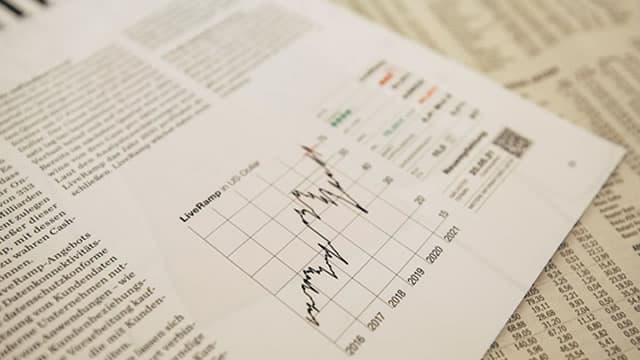
Stock market returns are broadening out Technology stocks' stranglehold on U.S. markets appears to be easing—a welcome development for stockpickers and diversified investors. Soaring shares of AI and other tech companies have fueled strong stock gains in recent years, while other sectors have languished.
It can seem like a nothing-to-buy market. But there are solid stocks out there.

Around 40% of private credit loans are concentrated in the software industry, which is under stress due to AI disruption, and this points to widespread defaults. Large banks are exposed; they lend to private credit via "creative financing schemes" like PIK.

Despite strong results and the accelerating 2026 AI data-center buildout—of which Nvidia remains the primary beneficiary—the stock has been stuck in the mud for months.

Friday's news did little to revive Trump Media stock.
Right now, the market is sending mixed signals. Cyclicals have led this year as some investors bet on faster growth.

Yields on 10-year Treasury notes fell below 4% for the first time since November this week.
U.S. jobs data will mark the highlight of the coming week as investors remain uncertain about when the Federal Reserve is next likely to cut interest rates.