加载中...
共找到 25,004 条相关资讯

Markets are responding primarily to uncertainty, with oil prices rising and equities volatile. The economic impact will depend largely on energy supply disruption, particularly whether oil prices remain contained or move sharply higher.

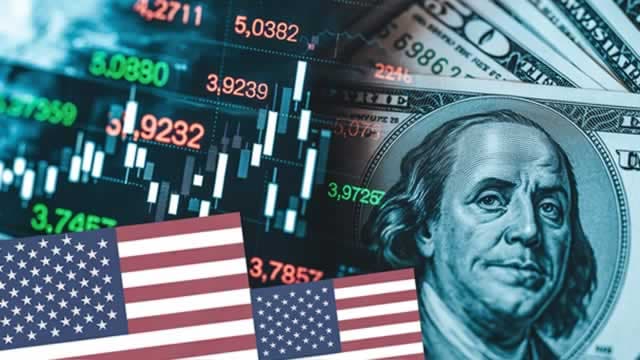
The dollar has registered strong gains against the euro and yen, two currencies which have been frequently mentioned as alternatives to the greenback.
Vietnam is on the cusp of joining the emerging-markets club and stocks have notched their biggest rally in years, but foreigners have been sellers and say investing is handicapped by tariff risks, ownership limits and one firm's dominance of the index.

The S&P 500 sagged in February as markets responded to fears related to AI disruptors while weathering updates to US tariff policy. The large-cap index retreated 0.9% from the end of January, although the Dow Jones Industrial Average rose 0.2%, according to S&P Global Market Intelligence data.

Wall Street's main indexes fell on Tuesday, with the S&P 500 hitting its lowest in over two months, as investors braced for the impact of a widening Middle East conflict on oil prices, inflation and global trade.
“Be greedy only when others are fearful,” said Warren Buffett. Conflict history shows it can work.

On February 28, the U.S. and Israel launched coordinated military operations against Iran, citing the need to neutralize “imminent threats from the Iranian regime.”. Although uncertainty can spark sharp market reactions, history suggests that equity sell‑offs driven by geopolitical events are typically short‑lived.
Foreign securities and US real estate investment trusts led a broad-based rally for the major asset classes in February, based on a set of ETF proxies. US stocks (VTI) were the lone loser last month, edging down 0.5%.
The CNN Money Fear and Greed index showed some easing in overall fear, while it remained in the “Fear” zone on Monday.

While it's tempting to assume the dollar's long-lost "safety" bid has returned since the weekend Iran attacks, it's not as clear-cut as it seems and owes more to relative energy plays. Yet the implications of the market response may be just as powerful.
Australian Energy Minister Chris Bowen said on Tuesday that consumers did not need to panic about fuel shortages amid concerns that the widening U.S.-Israeli war against Iran could deplete the country's stockpiles.
Carole Nakhle, CEO of Crystol Energy, says that the concentration of LNG suppliers pose a major risk to energy markets. She also discusses the timing of U.S.-Israel attacks on Iran, adding that the American President likely hopes that markets will correct by the time of the U.S. midterm elections.
China will unveil its next five-year plan at its annual parliamentary meeting, which kicks off on Thursday, setting out Beijing's ambitions for the economy and which sectors are lined up for funding and policy support.
The S&P 500 opened down more than 1% to start the week after the US attacked Iran over the weekend, but the index closed slightly positive by day's end. Key international equity ETFs like CWI (all world ex.

Paramount Skydance (PSKY) CEO David Ellison and COO and Chief Strategy Officer Andy Gordon spoke with Wall Street analysts and reporters Monday morning, laying out their vision of what the company will look like once the planned merger with Warner Bros. Discovery is completed later this year.One of the topics that came up was the future of the streaming services Paramount+ and HBO Max.

Markets closed the week with measured gains across major equity ETFs, even as geopolitical tensions escalated and volatility expectations rose sharply. Broad-based funds such as QQQM (+0.97%), SPYM (+0.59%), and VB (+0.94%) advanced modestly.
February 2026 delivered another broadly positive month, with U.S. real estate leading all asset classes at +5.27% and world stocks close behind at +5.19%. Managed futures posted a strong +3.04% gain in February, building on January's impressive +4.74% return.

US stock benchmarks gapped lower at the open but have bounced higher significantly since. Investor sentiment remains elevated despite the beginning of a rough conflict in the Middle East.

Macquarie Capital's Victor Shvets says the strength in the dollar index is the result of tactical choices, not a reflection of investors continuing to view the USD as a safe-haven. He also thinks that oil prices will come down again as the market is going through a temporary shock but not a structural change.

Asian government bonds sold off Tuesday amid fears that the Middle East conflict will drive inflation and faster interest-rate increases.