加载中...
共找到 25,414 条相关资讯
Operator: Hello, and thank you for standing by. My name is Tiffany, and I will be your conference operator today. At this time, I would like to welcome everyone to the FuelCell Energy, Inc. first quarter of fiscal 2026 financial results conference call. All lines have been placed on mute to prevent any background noise. After the speakers' remarks, there will be a question-and-answer session. If you would like to ask a question during that time, please press star then the number one on your telephone keypad. I would now like to turn the call over to Michael Bishop, Chief Financial Officer. Michael, please go ahead. Thank you, operator. Michael Bishop: Good morning, everyone, and thank you for joining us on the call today. This morning, FuelCell Energy, Inc. released our financial results for 2026, and our earnings press release is available on the Investors section of our website at www.fuelcellenergy.com. In addition to this call and our earnings press release, we have posted a slide presentation on our website. The webcast is being recorded and will be available for replay on our website approximately two hours after we conclude. Before we begin, please note that some information you will hear or be provided with today consists of forward-looking statements within the meaning of the Securities Exchange Act of 1934. Such statements express our expectations, beliefs, and intentions regarding the future and include statements concerning our anticipated financial results, plans and expectations regarding the continuing development, commercialization, and financing of our fuel cell technology, our anticipated market opportunities, and our business plans and strategies. Our actual future results could differ materially from those described or implied by such forward-looking statements because of a number of risks and uncertainties. More information regarding such risks and uncertainties is available in the safe harbor statement in the slide presentation and in our filings with the SEC, particularly the risk section of our most recent Form 10-K and any subsequently filed quarterly reports on Form 10-Q. During this call, we will be discussing certain non-GAAP financial measures, and we refer you to our website, our earnings press release, and the appendix of the slide presentation for the reconciliation of those measures to GAAP financial measures. Our earnings press release and a copy of today's webcast presentation are available on our website under the Investor Relations tab. For this call, I am joined by Jason Few, our President and Chief Executive Officer. Following our prepared remarks, the leadership team will be available to take your questions. I will now hand the call over to Jason for opening remarks. Jason? Jason Few: Good morning, everyone, and thank you, Mike. I appreciate everyone joining us today. Before we begin, I want to acknowledge the events unfolding in the Middle East. Our thoughts are with the civilians affected across the region, and we are grateful for the courage and service of the American men and women in uniform and those of our allies working to protect stability and safeguard lives. We hope for the safety of all innocent people and for a path toward peace. With that said, I would like to turn to FuelCell Energy, Inc.'s results and the progress our team continues to make. Let me set the stage before we dive into the quarter. FuelCell Energy, Inc. delivers continuous, scalable power for critical applications and grid resilience. Our mission remains unchanged. However, the world around us is changing rapidly. The explosive growth of AI, digital infrastructure, and compute-intensive workloads collides with a power system that cannot scale quickly enough. Interconnection timelines now take years instead of months, and customers simply cannot wait that long. This environment demands solutions that are proven, scalable, and ready to deploy immediately. And that is where FuelCell Energy, Inc. excels. We do not need to prove the need for distributed baseload power with our solutions. We have already demonstrated it over decades in utility-scale, real-world, and demanding environments. Please turn to slide four. I will focus today's discussion on a few key themes. First, commercially. Data centers are driving demand for power that does not depend on grid timing in the commercial sector. Our DC-native continuous platform is a ready backbone for data centers. We are seeing this shift reflected not just in conversations, but in the types of projects actively entering our pipeline. Second, operationally. Our momentum in South Korea is demonstrated by servicing the largest fuel cell plant in the world at nearly 60 megawatts and our collaboration under a 100 megawatt data center MOU. Additionally, we are moving carbon capture from concept to deployment. At the ExxonMobil Esso refinery in Rotterdam, we will demonstrate what our platform can do: capture carbon from an external point source while simultaneously generating power, delivering usable thermal energy, and producing hydrogen. One integrated system, multiple revenue streams, and zero wasted energy. We are also implementing the initial phases of our U.S. manufacturing scale-up to meet growing power demand. Third, financially. Our strong liquidity position enables us to pursue this opportunity with discipline, prioritizing execution, proof, and long-term value creation. Across all three, we emphasize proof over promise. Let me begin with a commercial update by turning to slide six. Our value proposition rests on five fundamentals: accelerated time to power, scalability, capital preservation, native DC power efficiency, and accelerated returns. Accelerated time to power. We design our solutions to power up sites quickly, giving customers reliable energy and enabling revenue generation in a much shorter time frame. This speedy deployment, without requiring grid connection, eliminates typical delays so operations and monetization start faster. Infrastructure-grade scalability. Our technology allows seamless growth from initial megawatt-scale projects to hundreds of megawatts, ensuring infrastructure-grade reliability. As demand rises, our proven solution makes expansion efficient at scale. Capital preservation. And regulatory resilience, flexible, phased capital deployment means customers invest as they grow, minimizing risk. Our ultra-low emissions profile reduces permitting hurdles, making regulatory navigation easier. AI-native architecture. DC-native power backbone aligns perfectly with the requirements of AI and high-density compute workloads, eliminating inefficient AC-to-DC conversions. This compatibility supports next-generation data center design and maximizes system efficiency. Revenue and return acceleration. We are able to deliver faster returns by providing rapid time to power, greater usable capacity, and flexible capital deployment without relying on grid timing. Next, we will go one layer deeper on two of these areas, AI-native architecture and efficiency through thermal integration, by turning to slide seven. As AI workloads redefine power requirements, we help customers rethink power delivery inside their facilities. Our ability to deliver native DC output stands out. While most data centers operate internally on DC, most generation systems still require multiple AC-to-DC conversions before power reaches the rack. Each conversion adds cost, complexity, energy loss, heat, and potential failure points. By producing native DC power, our platform reduces conversions, simplifies electrical architecture, and improves system efficiency and reliability, especially at the scale and density that AI demands. This shift is not theoretical. It is being articulated publicly by industry leaders. At the 2025 GPU Technology Conference, or GTC 2025 as it is known, in an interview with Data Center Dynamics, Jensen Huang, CEO of NVIDIA, stated, we are moving from tens of kilowatts per rack to hundreds of kilowatts and ultimately toward megawatt-class racks. Power and cooling are now the fundamental constraints of AI infrastructure. Similarly, Giordano Albertazzi, CEO, Vertiv, has publicly noted that rack densities are nearing one megawatt. As rack density approaches the megawatt class, infrastructure must scale in kind. Our 1.25 megawatt modular block delivers native DC output and aligns directly with a one megawatt rack architecture, enabling a more direct, efficient path from generation to compute. Time to power and power efficiency are no longer secondary considerations. They are gating factors for deployment. This is not just a future concept. DC ecosystems already thrive across EVs, renewables, and storage. Now data center operators are actively asking a logical question: Should power generation align more directly with the way power is consumed? Turning to slide eight. It may sound counterintuitive for a power generation company to reduce electric demand. But this is exactly what our platform enables. In reality, it is a capital efficiency discussion. Cooling can represent approximately 25% to 30% of a data center’s total electricity consumption, and that percentage is rising as AI workloads increase rack density and thermal intensity. Cooling is essential, but it does not generate revenue. Every megawatt allocated to cooling is a megawatt not allocated to compute. Power Usage Effectiveness, or PUE, measures how much energy reaches IT equipment versus how much is consumed by supporting infrastructure. As density rises, managing PUE becomes a greater factor in data center economics. Our platform technology provides a differentiated solution. We produce high-quality thermal energy as part of combined heat and power. When paired with absorption chilling, that heat, which would otherwise be rejected, is converted into chilled water to support cooling requirements. The result is an integrated power, heat, and cooling configuration that reduces electric cooling load, improves PUE, and will shift more available power to revenue-generating compute. In constrained power environments, this is not incremental efficiency. It is a structural advantage. This quarter, we advanced our strategic collaboration with Sustainable Development Capital (SDCL). Together, we have identified up to 450 megawatts of discrete data center and distributed generation opportunities globally. FuelCell Energy, Inc. will provide the power platform and long-term operating and service capability. SDCL brings institutional capital, structuring expertise, and infrastructure asset management. Our collaboration is designed to address what matters most to customers: proven technology and dependable execution at scale. We are advancing these opportunities with discipline, focusing on development milestones, managing risk deliberately, and we will structure each project to create durable value for customers, partners, and shareholders alike. Please turn to slide 10. In the first quarter, we submitted more than 1.5 gigawatts of proposals, with data centers now making up over 80% of our pipeline. This reflects a structural shift in how customers are thinking about power: reliability, speed to deployment, and long-term risk mitigation. Our platform is well aligned with that demand. Our priority is disciplined conversion. We are focused on turning high-quality opportunities in our pipeline into contracted projects, building backlog with the right counterparties and financing structures, and progressing contracted projects to commercial operation. We will continue to emphasize durability over velocity, allocating capital and resources where risk-adjusted returns and execution certainty are strongest. Now let us turn to operations. South Korea remains an important operational and commercial market for us and a clear proof point of scale. Module deliveries at Goonga Green Energy Company Ltd. (GGE) and China General Nuclear (CGN) drove our product revenue in the quarter. Revenue would have been approximately $6 million higher had two modules been commissioned just days earlier. Those two modules are now online and contributing to Q2 2026 revenue. Importantly, our projects in South Korea demonstrate what few platforms can: utility-scale deployments of multiple 20 megawatt plants and 58.8 megawatts operating reliably for an average of ten years in market. The operating history matters. It is a tangible validation of scale, bankability, and execution, attributes increasingly required by data center customers globally. In addition, in connection with our collaboration under our MOU with InuVerse supporting the AI Daegu data center in South Korea, InuVerse recently announced a meaningful step: the execution of a land purchase agreement with Daegu University for the development of an AI Daegu data center. The message is consistent. Customers are selecting platforms with demonstrated performance at scale and long-term operating credibility. We are moving carbon capture from development to deployment. In April, we expect to ship two carbon capture modules to the ExxonMobil Rotterdam integrated manufacturing site. This project will mark the first demonstration of carbonate fuel cells capturing carbon directly from an external emission source while simultaneously producing power, hydrogen, and usable thermal energy. That capability is not theoretical, and it is not replicated elsewhere. Our molten carbonate platform is uniquely able to capture carbon at the source while maintaining power density and generating multiple revenue, or operational expense savings, streams from the same asset. That integration has the potential to materially lower the net cost of capture. Later this year, we believe that differentiation will be on full display in Rotterdam. Captured CO2 can ultimately integrate into the Porthos infrastructure, a large-scale, open-access transport and storage network under development in the North Sea. We view this project not as a demonstration alone, but as a catalyst for commercialization. Carbon capture represents a second distinct growth factor for FuelCell Energy, Inc., differentiated from distributed generation and complementary to it. It positions us in markets where customers require practical decarbonization solutions with economic durability. This is a capability that will place our platform in a different category. Carbon capture is core to our carbonate platform, creating a fundamentally different long-term pathway for customers facing tightening emission standards. We take a disciplined approach to manufacturing scale. At our Torrington, Connecticut facility, we are making the initial investments to advance from 100 megawatts per year of maximum annualized capacity today toward 350 megawatts, more than a threefold increase within our existing footprint. This capacity expansion leverages a predominantly U.S.-based supply chain, proven electrochemistry, no reliance on rare earth materials, and over 23 years of manufacturing and operating experience at utility scale. Importantly, we have demonstrated our ability to scale before. We have produced fuel cell stacks in Torrington and shipped them to South Korea for final assembly and conditioning, enabling localized value creation and logistics synergies. We applied the same model in Germany, manufacturing stacks domestically and supporting final assembly and deployment into the European market. We know how to expand capacity through modular replication and distributed assembly without building entirely new factories. Scale is not theoretical for us. It is execution we have already delivered. We expect to invest $20 million to $30 million in fiscal year 2026 to support this optimization. Beyond that, expansion will be demand driven. We will build capacity in alignment with contracted volume and structured partner capital, not ahead of it. Advanced manufacturing techniques, including automation and modular replication, give us a clear pathway to scale efficiently toward one gigawatt and beyond. But we will do so deliberately, matching capital deployment to durable, financeable demand and maintaining stewardship of stockholder capital. I will now turn the call over to CFO, Michael Bishop, to discuss our Q1 financial performance. Michael Bishop: Thank you, Jason, and good morning to everyone on the call today. I will cover our first quarter financial results and backlog on slides 16 and 17 and then close with the liquidity and utilization discussion on slide 18. In 2026, we reported total revenues of $30.5 million compared to revenues of $19.0 million in the prior-year quarter, an increase of approximately 61%. This increase was primarily driven by module deliveries to GGE and CGN under long-term service agreements. We reported a loss from operations in the quarter of $26.3 million compared to $32.9 million in 2025, an improvement of approximately 20%. The net loss attributable to common stockholders in the quarter was $23.7 million, or $0.49 per share, compared to $29.1 million, or $1.42 per share, in the prior-year period. The improvement in net loss per share reflects both the reduction in net loss attributable to common stockholders and a higher weighted average share count due to equity issuances since 01/31/2025. Net loss was $26.1 million in 2026 compared to a net loss of $32.4 million in 2025. On a non-GAAP basis, adjusted EBITDA totaled negative $17.0 million in 2026 compared to negative $21.1 million in 2025. Please refer to the appendix of the earnings release, which provides a reconciliation of the non-GAAP financial measures. Turning now to slide 17, I will walk through the mix and key drivers of revenue, which was $30.5 million. Product revenues were $12.0 million, reflecting the delivery and commissioning of a total of four modules, two for GGE and two for CGN, under long-term service agreements. Revenue for the quarter was approximately $6.0 million lower than planned, driven by the timing of commissioning for two delivered and installed modules that entered service shortly after quarter end, which was previously planned to take place within the first quarter. Service agreement revenue increased to $3.2 million for the three months ended 01/31/2026 compared to $1.8 million in the prior-year quarter, reflecting higher service activity under the GGE long-term service agreement. Generation revenues decreased slightly to $11.0 million from $11.3 million, reflecting lower output from plants in the company's generation operating portfolio. Advanced technology contract revenues decreased to $4.3 million from $5.7 million. Revenue in the quarter included $1.7 million related to our joint development agreement with ExxonMobil Technology and Engineering Company (EMTEC) and $1.9 million related to the purchase order received from Esso Netherlands B.V., an affiliate of EMTEC and ExxonMobil Corporation, related to the Rotterdam project. There was also about $0.7 million of revenue recognized under government and other contracts for the three months ended 01/31/2026. Looking at the right-hand side of the slide, gross loss for 2026 totaled $5.9 million compared to $5.2 million in the comparable prior-year quarter, primarily related to increased gross loss from manufacturing variances and lower gross profit from advanced technology contracts, partially offset by higher gross profit for service agreement revenues and lower gross loss from generation revenues. Operating expenses for 2026 decreased to $20.4 million from $27.6 million in 2025, primarily due to a $4.1 million decrease in research and development expenses, a decrease of $1.5 million in administrative and selling expenses, and the lack of any restructuring expense recorded in 2026 compared to $1.5 million of restructuring expenses included in 2025. Finally, on the bottom right of the slide, you will see that backlog decreased approximately 10.8% to $1.17 billion year over year, primarily as a result of revenue recognized over the period from 01/31/2025 through 01/31/2026, partially offset by new contract backlog. Now turning to slide 18. Our liquidity remains a strength. As of 01/31/2026, we had cash, restricted cash, and cash equivalents of $379.6 million. During the three months ended 01/31/2026, we sold approximately 6.4 million shares of the company's common stock under the amended open market sale agreement at an average sale price of $8.82 per share, resulting in net proceeds of approximately $54.9 million. Subsequent to the end of the quarter, we sold an additional 3.0 million shares at an average price of $7.67 per share, generating net proceeds of approximately $2.5 million. During the quarter, we also closed a new round of debt financing with the Export-Import Bank of the United States, resulting in approximately $25.0 million of gross proceeds. We view this as continued support for exporting our differentiated U.S. energy technology while expanding delivery of utility-scale power in international markets such as South Korea through long-term service agreements. In closing, we remain disciplined in working to strengthen our financial foundation while sharpening commercial execution. We are seeing accelerating momentum in the data center market where evolving power requirements are creating meaningful near- and medium-term opportunities. Our priority is converting this pipeline of opportunities and driving operational leverage through higher utilization of our Torrington facility. As previously outlined, we are targeting future achievement of positive adjusted EBITDA once our Torrington facility reaches an annualized production rate of 100 megawatts per year. At the same time, we are maintaining balance sheet strength through capital-efficient financing structures, including our arrangement with EXIM and our collaboration with SDCL. I will now turn the call over to the operator to begin Q&A. Operator: We will now open for questions. At this time, if you would like to ask a question, press star, then the number one on your telephone keypad. To withdraw your question, simply press star one again. We kindly ask that you limit your questions to one and one follow-up for today's call. We will pause for just a moment to compile the Q&A roster. Your first question comes from the line of Dushyant Ailani with Jefferies. Please go ahead. Dushyant Ailani: Hi. Yes. Good morning. Thanks for taking my question. Guys, just wanted to touch on that 1.5 gigawatts of proposals that you submitted. Could you walk us through what the next steps would look like before we can see a project being added to the backlog? Jason Few: Yes, Dushyant. Thank you very much for that question. As it relates to backlog, just to clarify our position on that, everything that is in our backlog are firm, committed orders before it goes into backlog. So even upon a project award, we would not move it to backlog until such time that we have finalized all of the contracts. So from the submittals that we have made, what the team is doing now is going through technical details, working through initial considerations around the contract, and trying to work with those customers to advance it to full contract negotiation and ultimately contract closure. We think that the opportunity that we have around that set of projects really starts to materialize over the coming quarters, but the team is in active negotiations on all of those as we speak. Dushyant Ailani: Understood. That is helpful. And then maybe also, kind of touching on the MOU with InuVerse. Can you talk about the key milestones there to think about that as well on how that kind of converts to a definitive agreement? Jason Few: Sure. So as we discussed, one of the key milestones was actually them solidifying and lining up the land. So that is now done. And so now the next phase of that is really working through the off-takers and who is going to be part of that site in Korea. So for us, we will begin to be part of designing architecture and planning around the power delivery for that site, working collaboratively with InuVerse. Dushyant Ailani: Understood. Thank you. Jason Few: Thank you. Operator: Your next question comes from the line of Jason Tilchin with Canaccord Genuity. Please go ahead. Jason Tilchin: In the prepared remarks, you talked about the percentage of sales pipeline from data centers doubling over the past year. Specifically, as it relates to the partnership with SDCL, can you talk to the experience they bring to the table, how that changes the math in terms of the types of projects you are exploring, and potentially the timelines for when those could move forward? Jason Few: Yes. For sure. Jason, thank you. So if you think about SDCL, SDCL as a private equity firm, or really an infrastructure fund, you can think about them that way. Today, they own multiple gigawatts of projects that they run and operate as a provider for that. SDCL believes very strongly in delivering sustainable power generation projects on a distributed basis. So what they bring is not only the opportunity from a financial investment standpoint, but also just their experience in delivering large-scale infrastructure projects and being part of running and maintaining those. And so as we think about our way in which we deliver projects, our ability to run and maintain remotely, provide service wrappers around that, we think the combination between us and SDCL is very strong, and we are aligned in terms of what we want to be able to deliver to customers. Jason Tilchin: Okay. Great. That is very helpful. And then just as a quick follow-up, the run rate at Torrington was a bit lower in Q1 than it was in Q4. Could you just speak to some of the puts and takes there? And how should we be thinking about the gating factors and timeline getting closer to that 100 megawatt target? Michael Bishop: Sure. Good morning, Jason, and thanks for joining the call. So really just seasonal around Q1. It was a little bit lower than where we were in Q4. Today, we are targeting a current run rate in the 40–41 megawatt range. But as Jason described, as we get traction on new commercial, we will look to increase that run rate, and as I discussed in my remarks, we are still targeting positive adjusted EBITDA when that run rate achieves 100 megawatts. Jason Tilchin: Great. Jason Few: Thank you very much. Operator: Your next question comes from the line of Manav Gupta with UBS. Please go ahead. Manav Gupta: Good morning. I actually had just one question. Can you talk about the benefits of absorption chillers? How it makes the fuel cell offering more competitive, what it does to the overall efficiency of the system if you can combine your fuel cells with absorption chillers, versus a simple-cycle gas turbine or a combined-cycle gas turbine. If you could talk around those dynamics, I will be very grateful. Thank you. Jason Few: Thank you very much for the question. If you go back to page eight in our presentation, what we tried to do there is really lay out a very straightforward example of the benefits of leveraging absorption chilling. When you think about power usage being 20% to 30% going toward cooling, our ability to deliver absorption chilling by leveraging the thermal properties of our platform, which is the ability to deliver high-grade steam and integrating with steam-efficient absorption chilling, adds to the efficiency of actually delivering a cooling solution. You can pick up not only additional cooling capabilities but reduce the power required, effectively increasing the PUE of that data center. And just taking a simple example, if you think about a 100 megawatt data center today, where maybe 69.5 megawatts are going toward IT load, by leveraging chilling, you can increase the amount of power going to the IT load. And if you think about the offset between delivering absorption chilling, the CapEx required around that, but the operational efficiencies and pickup and reduction of power, the example that we are showing here, you pick up about $127 million in incremental value over that 20-year period. So we think that is a really strong value proposition. And the capability to do that is inherent in the platform. So I think as power density and heat continue to increase, and a bigger focus on delivering more compute power to the racks, absorption chilling becomes a very compelling opportunity for data center customers. And as a company, we have demonstrated our ability to do that. We have delivered absorption chilling solutions. And if you just think about the core capability that we need to have there, that is actually the recovery and delivery of that heat. So if you go beyond just even looking at what we have done in terms of absorption chilling, if you look at our solutions today where we are delivering district heating, or where we are delivering steam to an entire steam loop, providing steam across an industrial complex, really showing our capabilities in this area. And so we think that we have a unique advantage to really deliver a strong value proposition via absorption chilling. Manav Gupta: Thank you. Jason Few: Thank you. Operator: Your next question comes from the line of Ryan Pfingst with B. Riley. Please go ahead. Ryan Pfingst: For the 1.5 gigawatts of proposals delivered in 1Q, could you break that down a bit by geography or perhaps average project size? Jason Few: Yes. So the vast majority of those projects are weighted toward the U.S. market. And they range across customer types from hyperscalers to colocation developers, infrastructure players, also real estate developers and power land developers, if you think across the whole set of opportunities that we are talking about. And the average sizes for these typically are in the 50 to 300 megawatt range when you think about that as a per facility. So you might have larger sites, but when you think about really powering a number of sites at a particular location, and as those data centers scale their capacity, we are seeing the building block sizes match very nicely to our scalability. Ryan Pfingst: Got it. Appreciate that, Jason. And then with the two carbon capture modules expected to ship next month, can you talk about the next milestone to look out for there? Jason Few: Yes. So we will ship the modules to Rotterdam, and ExxonMobil is completing the work that they need to do on their end at the Esso refinery there. And so the team will go through an integration process. We are actually setting up the platform to be able to capture the flue gas directly from the Esso refinery. And, ultimately, upon completion of that work, we will be demonstrating our ability to directly capture carbon from the point source while simultaneously producing power, hydrogen, and thermal energy. And we think the combination of being able to deliver those three incremental value streams, and certainly the efficiency that comes from being able to capture directly at the point source, gives us an opportunity to deliver what we ultimately believe will be a very compelling low cost of capture. In addition to the fact that one of the other things that this demonstration will show is something that is very difficult for other carbon capture technologies to do, and that is to actually capture carbon from lower CO2 concentration streams. So when you start to get to 6%, 8%, 12% streams of carbon, it becomes a lot harder to capture that CO2. We are going to demonstrate how efficiently and effectively we can do that. So this demonstration will show those two things, we think, quite well: the simultaneous production of three revenue streams and the ability to capture CO2 in a low CO2 concentration stream. Ryan Pfingst: Got it. Jason Few: Appreciate it, guys. Thank you. Operator: Your next question comes from the line of Colin Rusch with Oppenheimer. Please go ahead. Colin Rusch: Thanks so much, guys. Can you talk a little bit about the modular design you are working with on some of these data centers, the building blocks that we can think about, and how leverageable this first award will ultimately be in terms of being able to drive a template for other customers to use for building out similar-type facilities? Jason Few: Colin, thank you for your question. So our building block size is a 1.25 megawatt building block size. And as we look to deploy larger sites, we pair those, and you can think about it in a two-by-two configuration. So we are delivering 2.5 megawatt blocks essentially to customers. And so if you think about what a data center is ultimately trying to do, they want to match not only the power they need for compute, but the power they need for the overall facility. And as we just talked about, if they leverage our absorption chilling capabilities, they will actually need less power. And then as that data center scales, our ability to scale in lockstep with that data center customer, we think, gives us an advantage. So if you think about a 100 megawatt data center, the next block of power they need is probably not another 100 megawatts. Maybe it is more like 20 or 50. And so our modularity gives us the ability to match exactly to the power needs that that data center customer has. In addition to that, as we think about the value proposition that we offer overall, not only in terms of accelerated time to power—we have demonstrated our ability to deliver infrastructure-grade scalability across our deployments that we have today—but we think that we also offer two additional really compelling things. Ultimately, the ability for that customer to transition to DC when the market moves that direction. And the fact that our building block is 1.25 megawatts and rack sizes are going to a megawatt, that is a perfect alignment with our building block. And the whole goal there is actually to reduce the number of products needed, the number of connection points, the number of piping and wiring, and other things that are required to make that data center operate. So that matchability with our platform at 1.25 megawatts is really compelling. And then the other piece is just around our ability to really provide not only that capital preservation, but regulatory resilience. So as you think about a changing regulatory environment, our low emissions profile, our lack of SOx, NOx, and other particulates, the fact that we operate near-silent, and our platforms are deployed carbon capture-ready, the ability to ultimately take advantage of that and deliver that to a customer when they are ready, we think, puts us in a really nice position. And in terms of leveraging, we think the initial commercial win successfully deploying and delivering power to that data center customer will serve just as yet another proof point of our ability to deliver utility-scale distributed power generation. And now we will have a reference, if you will, of a data center customer, and we think that is ultimately really leverageable by our sales team and the other customers that they are working with to close transactions. Colin Rusch: Thanks so much. And then just turning to the operational side, it looks like you guys are set up for a pretty substantial amount of operating leverage as you scale revenue. Could you just talk about what other elements you need for the organization to really meet the opportunity that you see coming on the data center side? Michael Bishop: Good morning, Colin. Thanks for joining. So, yes, as you mentioned, we are set up for scale. And as I said in my remarks, as we get closer to 100 megawatts of production volume, we get to adjusted EBITDA positive. But also, as Jason talked about in his remarks, as you look at how we scale beyond 100 megawatts, we have plans in place to expand Torrington to at least 350, and then plans beyond that. And we have allocated a range of capital this year to begin that with long-lead items. So, as an example, we are installing a high-capacity tape caster. So that is an example of what is going into the factory today. But also what we have talked about is essentially a hub-and-spoke model to really optimize Torrington, to bring final assembly and conditioning facilities closer to where our customers are, and we will gain a lot of leverage from that by having lower operating costs and lower transportation costs to the company or to the customers, and then also being able to localize certain activities. This is a model that we followed in the past with the activity that we have done in Korea and Germany. So those are a few examples that I would point to. Colin Rusch: Thanks so much, guys. Jason Few: Thank you. Operator: Your next question comes from the line of Noel Parks with Tuohy Brothers. Please go ahead. Noel Parks: Hi. Good morning. Just had a couple. And I was wondering if you could maybe talk about what you are seeing in your contract negotiations overall since you said so much of your pipeline is the data center business. I was wondering, in particular, if there are any differences on service terms with this customer base compared to historically, either in terms of how willing they are to go into the service agreements with you, whether they balk at all on pricing, or whether they are sensitive to duration. Anything like that would be really interesting. Jason Few: Thank you for the question. So as we have the conversations with data center customers, if we just focus on that for a moment, we are not seeing resistance to service agreements. I mean, if you think about their core business, they want to deliver data center compute to their customers. They are not necessarily looking to be in the business of managing generation assets. And one of the benefits of our platform is the fact that we can and we do run and operate the platform remotely. And our service wrapper includes all of the service and maintenance as well as the repowering of those modules as part of our service agreement. So we are not seeing any resistance to that. We are having conversations with customers around duration, as customers really try to balance between how they lay out their full architecture and continue to think about when grid connections might be available, and then how that ultimately plays into the architecture that gets deployed. So in a pure behind-the-meter scenario where a grid connection may be five years out or more, they really like to think about, okay, what does that mean in terms of the power need once that grid connection becomes available, and if that grid connection would even be to the level of power that they would need for the data center anyway. So the conversation we are having is about how does the grid come along, we operate in a parallel way, they look at the grid as a way to get incremental power or even perhaps serving as part of the backup architecture for the data center. It is more of an integration conversation as opposed to an either/or conversation that we are having with our customers. Noel Parks: Great. Thanks. And you are talking about sort of the horizon of a 100 megawatt capacity at Torrington and ultimately seeing a path to 350 megawatt capacity. And with the data center market so strong, it sort of feels like there is an inevitability or maybe an unusual degree of visibility to very strong growth trends. I just wonder, is there any interest on your part or from parties approaching you on the financing side about maybe securing that financing? I mean, maybe not pulling the trigger on it in terms of execution, but, for example, an infrastructure fund or something like that being willing to come in at this point and say it is really likely your demand is going to bring you to that capacity, and can we set up what that might look like now, even if only conditionally? So I just wondered about that because, like I said, the visibility seems pretty good. Michael Bishop: Hi, Noel. This is Mike, and thanks for that question. Yes. So as we have laid out, we have a very strong commercial pipeline around data center opportunities. We talked about a gigawatt and a half of recent proposals. The company is doing a lot of planning around these opportunities. I talked about the expansion in Torrington to 350 megawatts, and then Jason's remarks talked about additional potential expansion, 500 megawatts to a gigawatt, beyond the Torrington factory. So as part of our planning, we are planning for financing for this as well. As Jason said in his remarks, as we get closer to final investment decisions, we will have more to say around capacity expansion and potentially financing that goes along with that. Noel Parks: Okay. Great. Thanks a lot. Jason Few: Thank you. Operator: That concludes our question-and-answer session. I will now turn the call back over to Jason Few for closing remarks. Jason Few: Thank you, Tiffany. Thank you, everyone, for joining today's call. In summary, the first quarter reflects progress in several key areas: robust revenue growth, strengthened operating discipline, improved liquidity, and continued advancement in commercial and operational priorities. More importantly, these results reinforce a broader point. We have already proven distributed baseload power works. What is changing is who needs it, how urgently, and at what scale. We remain committed to disciplined execution, converting the pipeline thoughtfully, advancing vital programs like Rotterdam, and continuing to scale our platform for the long term. Before we conclude, I want to thank our team members, customers, partners, and shareholders for their continued support. The team at FuelCell Energy, Inc. remains focused on executing our strategy, advancing our technology, and delivering reliable, resilient power solutions that strengthen energy infrastructure around the world. Thank you again for your time today, and we look forward to updating you on our progress next quarter. Operator: Ladies and gentlemen, this concludes today's call. Thank you all for joining. You may now disconnect.

US stock benchmarks have significantly gapped lower from weekend angst but are attempting a rebound. Participants are now pricing a prolonged US-Israel-Iran war and more disruptive effects from the conflict.

The explosive boom in artificial intelligence is creating enormous wealth and technological breakthroughs—but it may also leave a trail of casualties.

I anticipate a prolonged Middle East conflict, likely lasting several months, with oil supply disruptions and the potential for prices to exceed $200. Markets are underestimating the duration and severity of the crisis, as seen in oil futures backwardation and resilient US equities.
Are prediction markets poised to win over big institutional players? Robinhood CEO Vlad Tenev joins Tracy Alloway and Joe Weisenthal on the Odd Lots podcast to discuss where the company stands in the prediction market space, how he thinks betting markets will grow and what he thinks about the alien disclosure contract.

Are prediction markets poised to win over big institutional players? Robinhood CEO Vlad Tenev joins Tracy Alloway and Joe Weisenthal on the Odd Lots podcast to discuss where the company stands in the prediction market space, how he thinks betting markets will grow and what he thinks about the alien disclosure contract.

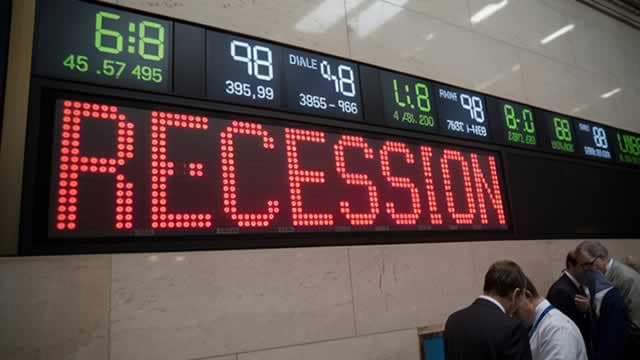
Stock-market jitters are back. But some experts think investors aren't jittery enough.

Selloffs in South Korea, Japan, and Taiwan highlight supply-chain and energy risks that could eventually spill into U.S. markets as the Iran conflict escalates.

Oil's surge toward $120 per barrel is rattling energy markets and fueling inflation fears. But for one corner of the market, the spike could be a tailwind.

During the fourth quarter of 2025, U.S. financial markets extended their advance while navigating a narrowing margin for error across policy, valuation, and economic data. The period was defined by a complex mix of moderating inflation, softening labor conditions, fiscal uncertainty, and the continued, but increasingly scrutinized, buildout of artificial intelligence infrastructure.

Defense giants are emerging as relative winners from the Iran war and the oil shock roiling global markets, with investors flocking to the largest U.S. primes as hedges against escalating conflict and inflation risk.

Two US banks posted double-digit percentage growth in assets on a sequential basis in the fourth quarter of 2025, causing a shake-up in the US banking industry asset rankings. In the most recent quarter, the 50 largest US banks reported a $186.20 billion increase in assets, with 38 institutions posting growth.

We currently recommend a 60% stock allocation, awaiting a confirmed ST-MSI sentiment signal before increasing exposure. We are reviewing if the war has changed this.
Main Management CEO Kim Arthur tells CNBC's Dominic Chu on ‘Halftime Report' what he's seeing in his sector rotation fund, and whether the volatility is exacerbating that trend - or reversing it.
The price of oil continued to surge Monday as the war in Iran stretched into its second week, raising questions about its effect on consumers, markets and the global economy.

The president insists conflict with Iran will be brief, but world leaders are preparing for severe economic blowback.

A big story in 2026 has been how well international markets have done, especially South Korea. At its peak in late February, the KOSPI, South Korea's main stock index, was up nearly 50% year todate.

Accept it, you can't pick a stock market bottom. NO one can.

Implied volatilities spiked across asset classes last week as the Iran conflict escalated, with oil prices jumping over 35%. Given the relatively modest SPX index decline of -2% last week, the “expected” VIX index increase was only +2.4 pts.

Wall Street opened the week still in negative territory as tensions in the Middle East continued to ripple across global markets.